The Best Online Tools to Visualize Binary Trees
Whether you are a first-year computer science student trying to understand pointers, or a senior backend engineer debugging a custom database index, visualizing data structures is a mandatory step in the learning process.
Whether you are a first-year computer science student trying to understand pointers, or a senior backend engineer debugging a custom database index, visualizing data structures is a mandatory step in the learning process.
Reading about node traversal in a textbook is abstract. Staring at terminal logs full of nested brackets is confusing. To truly understand how algorithms manipulate memory, you need a dynamic tree visualization tool.
In this guide, we break down the best types of online virtual labs and simulators for visualizing binary trees, highlighting what features you should look for depending on the specific data structure you are trying to build.
1. The Specialized AVL Tree Visualizer
Best for: Students and developers specifically studying self-balancing trees, balance factors, and structural rotations.
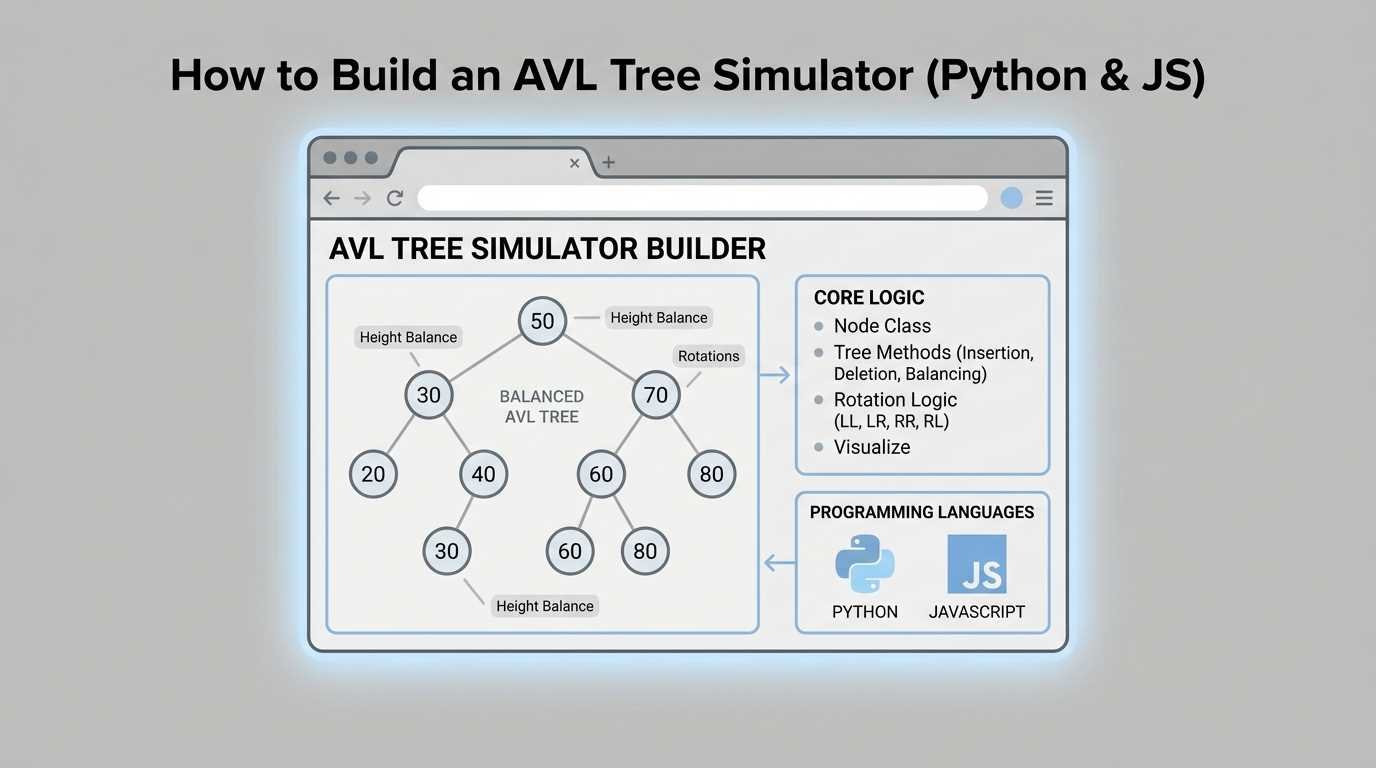
If you are studying AVL trees, a generic binary tree visualiser will not help you. You need a tool explicitly built to calculate height constraints and animate complex rotations.
Top Recommendation: AVL Tree Visualizer
Why a specialized tool wins for this specific structure: * Live Balance Factors: Unlike generic simulators, a dedicated AVL tool displays the mathematical balance factor (e.g., -1, 0, +1, +2) directly on the node in real-time. * Rotation Animations: When an imbalance occurs, the tool doesn't just snap to the final result. It animates the exact Left-Left, Right-Right, Left-Right, or Right-Left rotation so you can trace the pointer changes. * Operation History: It includes a terminal-like log that explains why the algorithm triggered a specific rotation, acting as a step-by-step tutor.
2. Standard Binary Search Tree (BST) Simulators
Best for: Beginners learning basic left/right insertion rules and time complexity degradation.
Before tackling self-balancing trees, you must understand the standard Binary Search Tree. A standard BST visualizer allows you to insert data and watch how the tree branches out naturally.
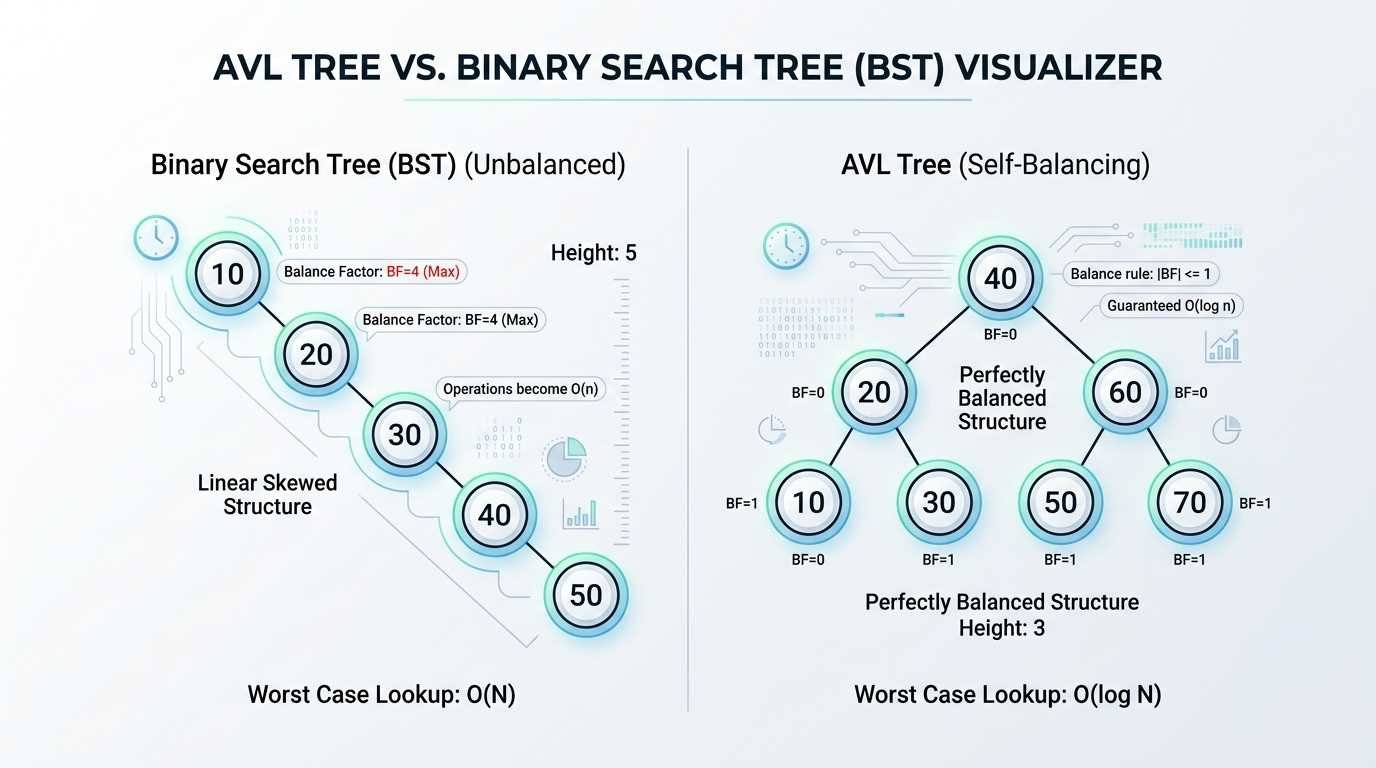
What to look for in a BST Visualizer: * Highlighting Paths: When you search for a value, the tool should visually highlight the path from the root to the target node, demonstrating $O(\log n)$ traversal. * The "Linked List" Test: A good BST simulator will allow you to insert sequentially sorted data (10, 20, 30, 40) so you can visually prove that an unbalanced tree degrades into a straight line (resulting in $O(n)$ worst-case search times).
While many universities host legacy Java applets for this, modern HTML5 and JavaScript-based tools offer a much smoother, plugin-free experience directly in your browser.
3. Comprehensive Algorithm Virtual Labs (VisuAlgo / USFCA)
Best for: Broad overviews of multiple data structures (Graphs, Sorting Algorithms, Hash Tables, and Trees).
Academic institutions and educational platforms often build massive suites of visualization tools. Two of the most famous in the computer science world are VisuAlgo and the USFCA (University of San Francisco) Data Structure Visualizations.
- Pros: These platforms are incredibly comprehensive. If you need to visualize a B-Tree, a Red-Black tree, Dijkstra's shortest path algorithm, and a standard binary tree all in one sitting, they have a module for it.
- Cons: Because they cover everything, their UI can sometimes feel cluttered or overly academic. They are built as broad lecture aids rather than focused, single-purpose virtual labs.
If your only goal is to understand why a Left-Right double rotation is failing in your Python script, navigating a massive academic suite might be overkill compared to using a dedicated, lightweight AVL simulator.
4. Tree Traversal Calculators
Best for: Understanding In-Order, Pre-Order, and Post-Order algorithms.
Visualizing the structure of a tree is only half the battle; the other half is visualizing how to read it. A tree traversal calculator is a specific type of visualizer that doesn't focus on insertion, but rather on reading existing nodes.
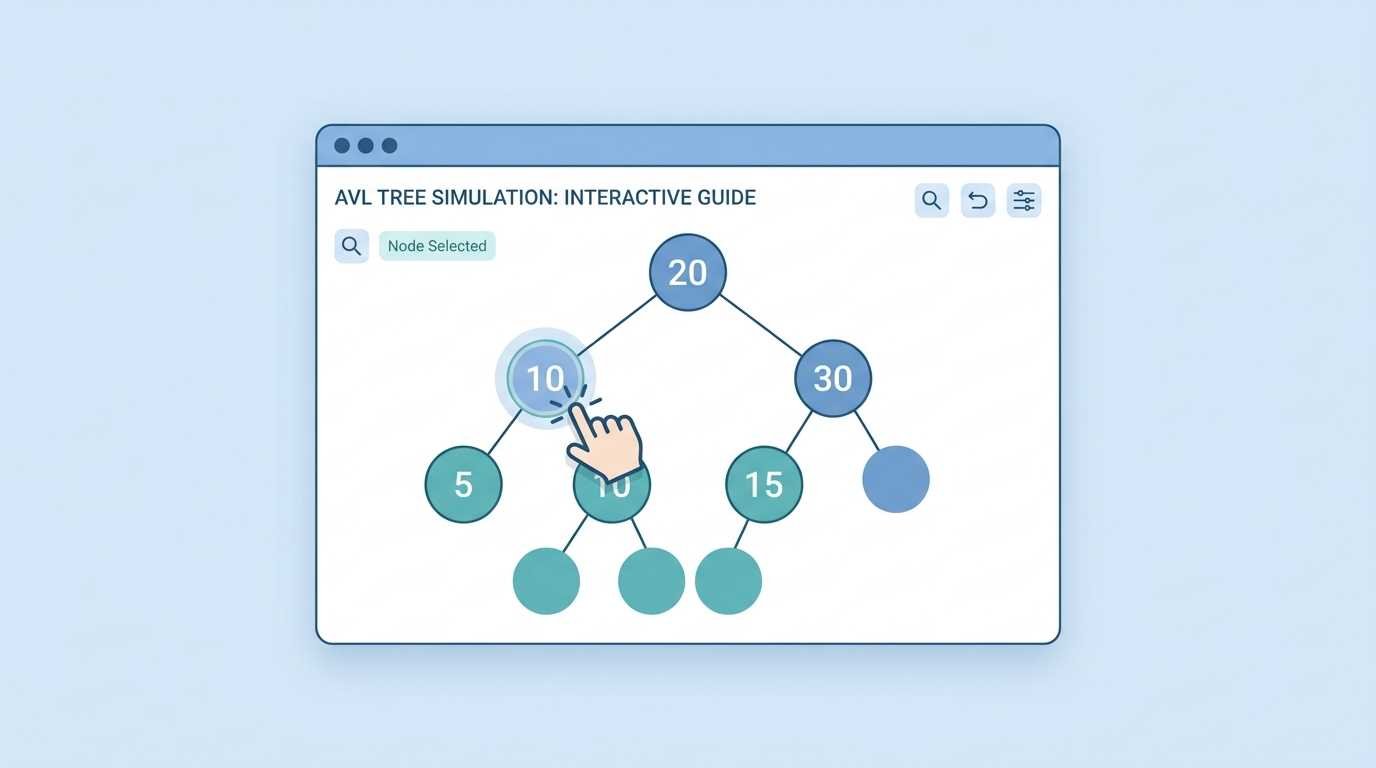
A strong traversal tool will animate a cursor jumping from node to node, printing the values to the screen in real-time. This is the absolute best way to visualize why an In-Order traversal of a binary search tree always results in perfectly sorted, ascending data.
Conclusion: Stop Guessing, Start Visualizing
If you are trying to write code for a tree data structure, do not rely on console logs. A simple print() statement cannot accurately represent the 2D spatial relationships of parent and child nodes.
By using a modern, interactive binary tree visualizer, you transform abstract mathematics into tangible, observable mechanics.
Ready to master tree balancing? Open the AVL Tree Simulator, load a few example rotations, and watch the algorithms balance themselves in real time.